
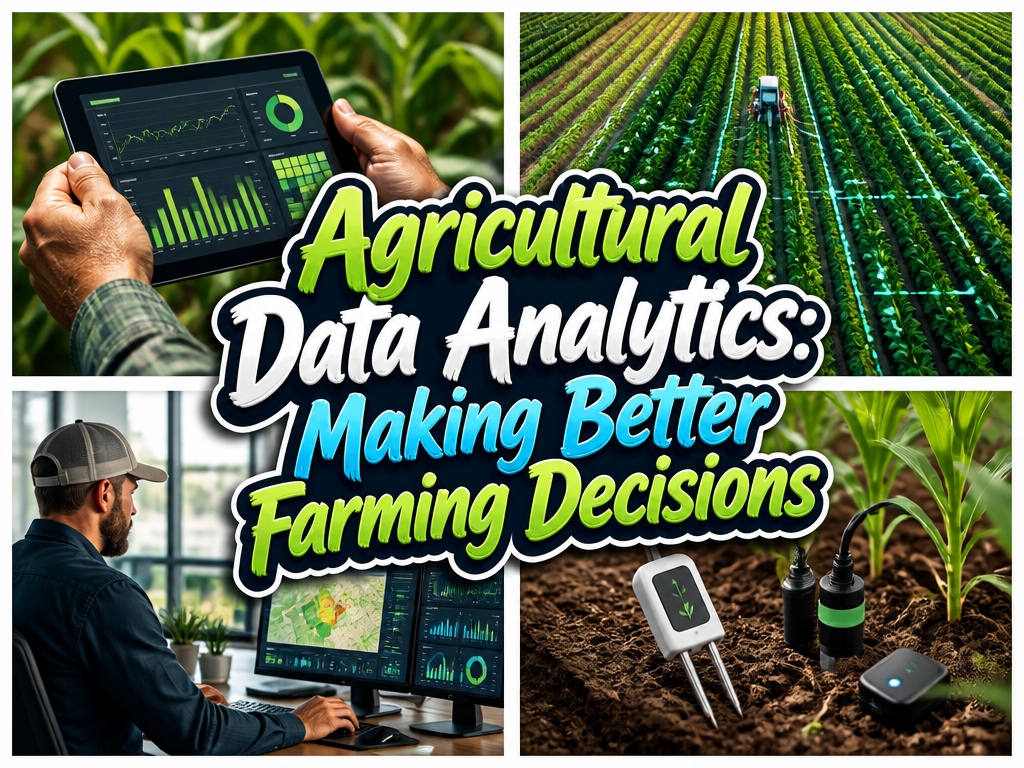
Dawn breaks over a soybean field in Iowa, and a farmer checks her phone before the coffee’s even ready. Soil moisture readings from sensors buried three feet deep tell her exactly which zones need water today and which ones don’t.
It’s easy to overlook how much guesswork farming still involves. Generations of knowledge matter, of course. But when a sudden heat wave hits or fertilizer prices spike, gut instinct only gets you so far.
That’s where the numbers come in, quietly filling gaps that experience alone can’t cover. You start noticing patterns you never saw before. Maybe your northeast corner always stays wetter than the rest, so you’re overwatering elsewhere to compensate.
Or pest traps show up four days earlier than you expected, giving you a real window to act instead of racing against damage already done.
What does all this information actually change? For some growers, the savings show up in obvious places, thousands of gallons of water unused, chemicals applied with surgical precision.
For others, it’s the avoided losses, the crop that didn’t fail because someone caught the problem in time. No two farms land in exactly the same spot, but the ones paying attention tend to find something worth keeping.
Soil Sensors, Weather Data, and Drones: What You’re Actually Measuring
Soil Sensors: What’s Happening Underground
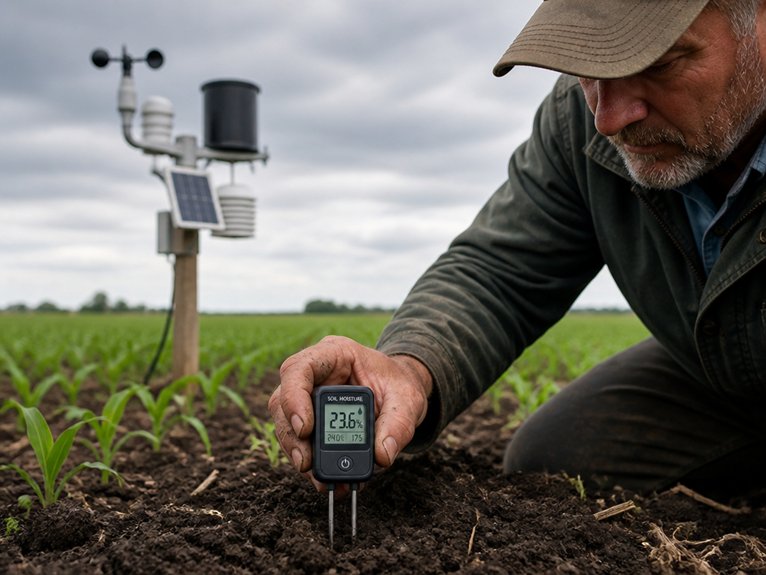
Soil sensors use probes placed at different depths. They track moisture, temperature, and nutrients. This data helps farmers know exactly when crops need water or fertilizer.
Weather Stations: Reading the Sky
Weather stations collect rainfall, humidity, wind speed, and air pressure. Farmers use this to predict growing conditions. It also helps spot when pests might become a problem.
Drones: The Aerial View
Drones carry multispectral cameras that capture images from above. These show crop health, irrigation coverage, and trouble spots across large areas. Problems become visible before they spread.
Putting It All Together
Each technology fills a gap the others cannot. Soil sensors cover what you cannot see. Weather data explains patterns over time. Drones scale across vast fields quickly. Together they turn raw numbers into clear decisions. Farmers set smarter schedules for watering, feeding, and harvesting. The guesswork fades. Resources stretch further.
Why Soil and Weather Patterns Transform Your Yield Predictions
The Soil and Weather Connection****
Crop forecasts improve dramatically when you pair soil data with weather insights. Soil moisture, nutrients, and texture shape how quickly plants grow. Temperature, rainfall, and sunlight decide if those plants flourish or falter.
Together, these datasets reveal the best times to plant and water.
Making Smarter Field Decisions****
Sandy soil dries out fast. It needs more frequent irrigation than clay, especially when drought hits. A late frost can wipe out young seedlings. Good spring rain, on the other hand, unlocks nutrients plants need.
Farmers who blend soil sensors with weather models catch these patterns early. They pick better seeds, time fertilizer right, and know exactly when to harvest. Uncertainty becomes something you can measure.
Real-Time Crop Monitoring Catches Problems Early
Sensors now sit ready across fields. They catch crop stress, disease, and pest damage before your eyes can spot them.
These systems include soil sensors, thermal cameras, and spectral analyzers. They gather data all season long. Farmers get alerts when nitrogen drops or fungus appears. Irrigation needs change? You’ll know right away.
Early detection means precise action. Less pesticide, less loss. Find powdery mildew on grapes in days, not weeks. Apply fungicide exactly where needed.
The system also tracks canopy health using NDVI measurements. Problems get fixed fast. Costs stay down, and yields go up.
Data-Driven Irrigation: Cut Water Waste and Costs
Agriculture uses about 70 percent of the world’s freshwater. Too much of it never reaches the plants that need it.
Data analytics changes this. Sensors track soil moisture around the clock. Weather stations monitor rainfall and temperature shifts. Farmers get alerts exactly when crops need water.
This prevents overwatering and drought stress at the same time. Typical farms cut water use by 20 to 30 percent.
Real Results in the Field
California vineyards use these systems. So do Midwestern corn growers. Both see clear cost savings. They also protect local water supplies.
The approach matches water delivery to what plants actually need. Crops grow better. Bills go down. Freshwater lasts longer.
Precision Fertilizer: Stop Overspending on What You Don’t Need
Fertilizer costs add up quickly. Many fields receive more nutrients than crops can actually use. That’s money left in the soil instead of your pocket.
Data tools now show exactly where nitrogen, phosphorus, and potassium are needed. This cuts waste dramatically.
Soil sensors track nutrient levels, moisture, and pH balance. They map conditions across different zones in your fields. Variable-rate systems then apply just the right amount to each spot.
A cornfield tells the story well. Low-lying areas with good water retention often need more nitrogen. Hilltops typically need less. You feed the crop, not the whole field equally.
Farmers using these techniques see 10-20% cost reductions. Yields hold steady or improve. The technology earns its keep through lower input costs and better performance across multiple seasons.
Predictive Analytics: Spot Pest Outbreaks Before They Spread
Pest populations grow fast when conditions are right. Early detection makes all the difference for containment.
Predictive analytics pulls together weather data, past pest patterns, and field sensors. It forecasts outbreaks before they happen.
Farmers get alerts when temperature, humidity, and moisture line up with pest reproduction cycles. Aphid populations spike during certain temperature ranges. Fungal diseases love high humidity. Machine learning models track these conditions across regions and seasons.
Historical data helps systems pinpoint vulnerable fields. Farmers can then target treatments to specific areas. This cuts pesticide use while protecting yields.
The approach saves money. It also prevents widespread crop damage through timely action.
What Your Equipment Data Shows You (That You’re Missing)
What Your Equipment Data Shows You (That You’re Missing)
The Hidden Information****
Your farm equipment gathers more data than you might realize. Onboard sensors track every movement, every fluctuation, every hour of operation. Most of this information goes unnoticed. That is a missed opportunity.
Patterns in Fuel and Performance
Fuel consumption tells a clear story. You can spot which fields drain your tanks faster than others. This often points to soil compaction or calibration issues that need attention. Engine efficiency drops gradually, and the data catches this decline early.
Maintenance needs show up before breakdowns force your hand. Hydraulic pressure readings, temperature changes, and wear rates all signal when something requires fixing.
What Your Transmission and Tires Reveal
Transmission strain during specific tasks is a red flag. It usually means an implement needs adjustment. Catching this early prevents costly damage down the road.
Tire pressure differences across wheels matter more than many realize. Uneven loads affect your yields and shorten equipment life. The sensors record this. You simply need to look.
Making the Shift to Prevention****
Farmers who ignore this data react to problems after they happen. They lose time and money to unexpected failures. They also miss chances to run their machines at peak performance.
Reviewing your equipment logs takes little time. The payoff comes quickly. Maintenance becomes planned rather than frantic. Downtime shrinks. Operating costs drop.
Understanding ROI: How Much Can Analytics Actually Save You?
Equipment data catches problems early. It prevents expensive failures and keeps machines running smoothly.
Analytics typically save farms 10-15% on fuel costs. Optimized field routes and maintenance schedules make this possible.
A combine harvester monitored for engine temperature and hydraulic pressure can avoid $5,000-$10,000 repairs. Reduced downtime during harvest season protects crop yields. These savings far outweigh monitoring software costs.
Precision application of fertilizers and pesticides decreases input expenses by 5-20%. Field data guides these decisions.
Equipment utilization tracking identifies underused machinery. This informs smarter purchase decisions.
Most operations recoup analytics investments within one to three seasons. ROI varies based on fleet size, crop type, and current inefficiencies. Farms with larger equipment investments typically see faster returns.
Getting Started: Choosing Tools for Your Farm’s Budget and Scale
Small farms can see ROI within one to three seasons. This opens the door to choosing analytics tools that fit your actual needs.
Start simple. Basic weather monitoring and soil sensors run $500 to $2,000 per year. These cover the essentials without overwhelming your budget.
Mid-sized operations have more options. Platforms like John Deere Operations Center or Climate FieldView typically cost $2,000 to $5,000 annually. They offer broader features without enterprise-level complexity.
Large farms need robust solutions. Expect to invest over $10,000 yearly for satellite imagery, drone data, and predictive modeling. These systems tie everything together.
Watch for four things when choosing: data compatibility, ease of use, technical support, and whether it works with your current equipment. Always try the free trial. Talk to neighbors running similar operations before you buy.
Frequently Asked Questions
How Do I Integrate Agricultural Data Analytics With My Existing Farm Management Software Systems?
Farmers can integrate agricultural data analytics by selecting compatible software platforms offering API connections, ensuring data standardization across systems, establishing secure data transfer protocols, and configuring real-time synchronization between farm management tools and analytics applications.
What Data Privacy and Security Measures Protect My Farm’s Sensitive Information?
According to the FDA, 60% of food safety issues stem from data mishandling. Farms protect sensitive information through encryption, role-based access controls, regular security audits, compliance with GDPR standards, and secure cloud storage with automatic backups.
How Much Training Do Farmers Need to Effectively Use Analytics Platforms?
Farmers typically require 2-4 weeks of foundational training covering platform navigation, data interpretation, and basic analytics concepts. Ongoing support through webinars and tutorials helps maximize proficiency and ROI from analytics investments.
Can Small-Scale Farms Benefit From Agricultural Data Analytics Affordably?
Ironically, the tools designed for industrial agriculture now empower small-scale farmers affordably through cloud-based platforms and mobile apps. Subscription models and open-source solutions democratize data access, enabling modest operations to optimize yields cost-effectively.
How Long Before Seeing Measurable Results From Implementing Data Analytics?
Farms typically observe measurable results within three to six months of implementing data analytics. Initial improvements emerge in crop monitoring and resource optimization, with more substantial yield and cost benefits accumulating over subsequent growing seasons.
Conclusion
Agricultural data analytics transforms farming by combining soil sensors, weather information, and crop monitoring into actionable insights. Farmers using these tools reduce water waste, optimize fertilizer spending, and catch pest problems early. The technology isn’t revolutionary enough to eliminate farming entirely, yet it measurably improves yields, cuts costs, and supports sustainable practices. Success requires selecting appropriate tools for farm size and budget constraints.